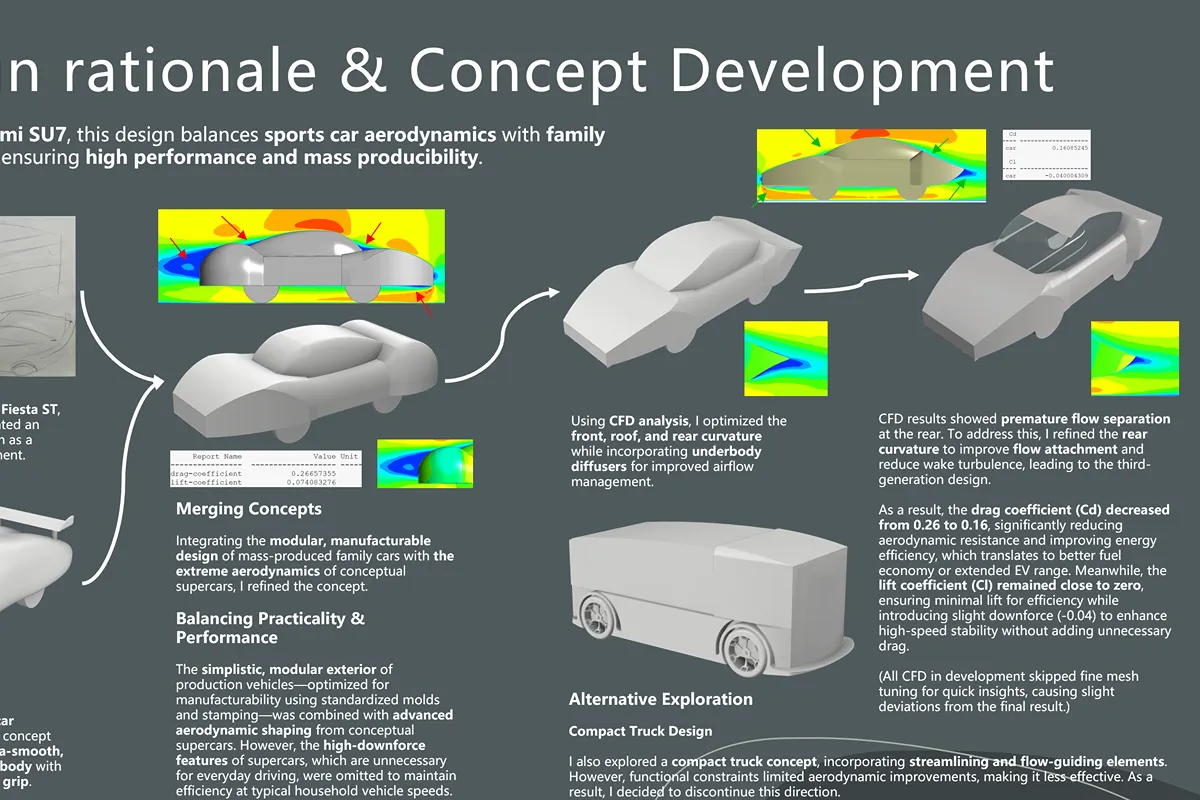
Final reported CFD Cd
At the documented 40 m/s inlet; the summary portfolio rounds the value to 0.16.
A concept vehicle refined through CAD, CFD and wind-tunnel testing.
 Inspect full-size image ↗
Open a chapter to follow the work and the choices made along the way.
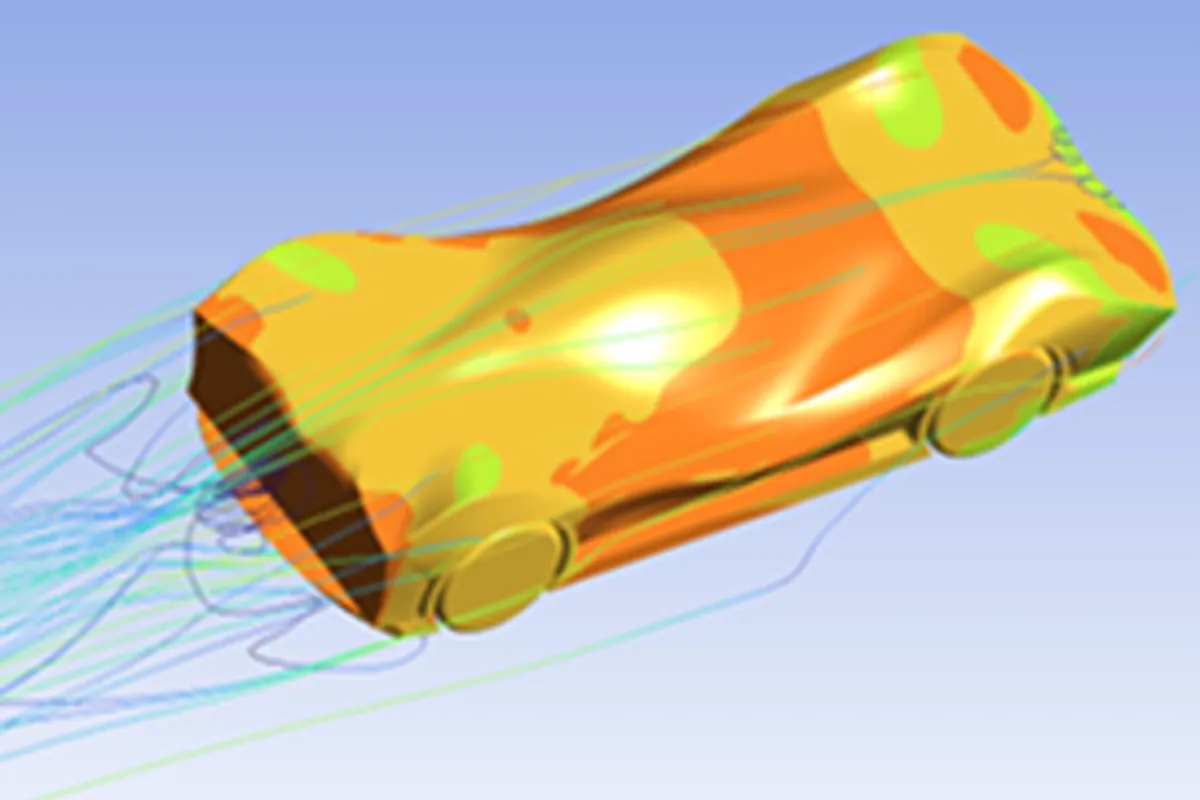
The roof, underbody and rear taper were refined as one continuous airflow system.
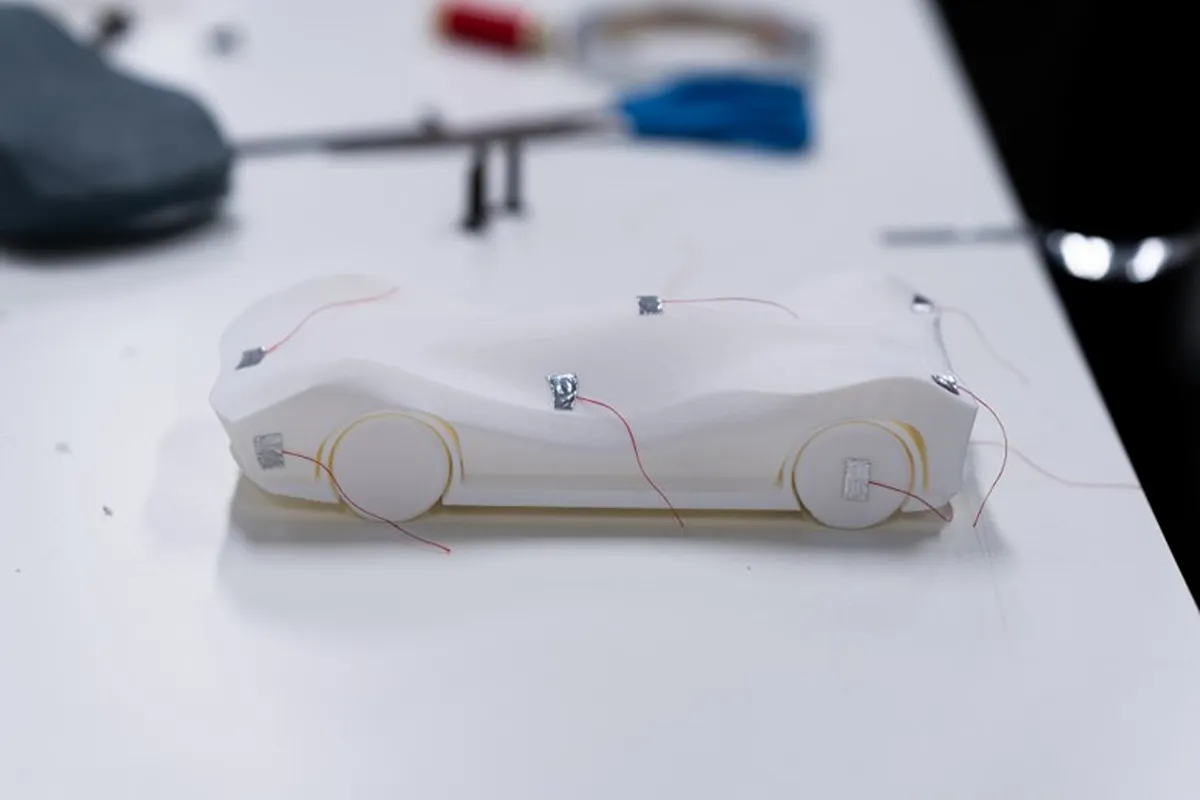
Inspect the supporting evidence ↓A physical wind-tunnel test challenged the CFD result and exposed model limitations.
Inspect the supporting evidence ↓Concept geometry in CFD, with shared course wind-tunnel experiments. Use the detailed report’s 0.169 final Cd; do not compare it directly with road-car marketing figures.
At the documented 40 m/s inlet; the summary portfolio rounds the value to 0.16.
Computed from 0.26 to 0.169. Not an on-road measurement or a like-for-like production-car benchmark.
Individual design work with shared course validation; the tunnel model is not proof of full-scale vehicle performance.
Final Cd 0.169, initial 0.26, inlet 40 m/s.
Rounded summary and shared experiment context.
Displayed design is independently completed; some course experiments were shared.
Related by practice, not just by category.
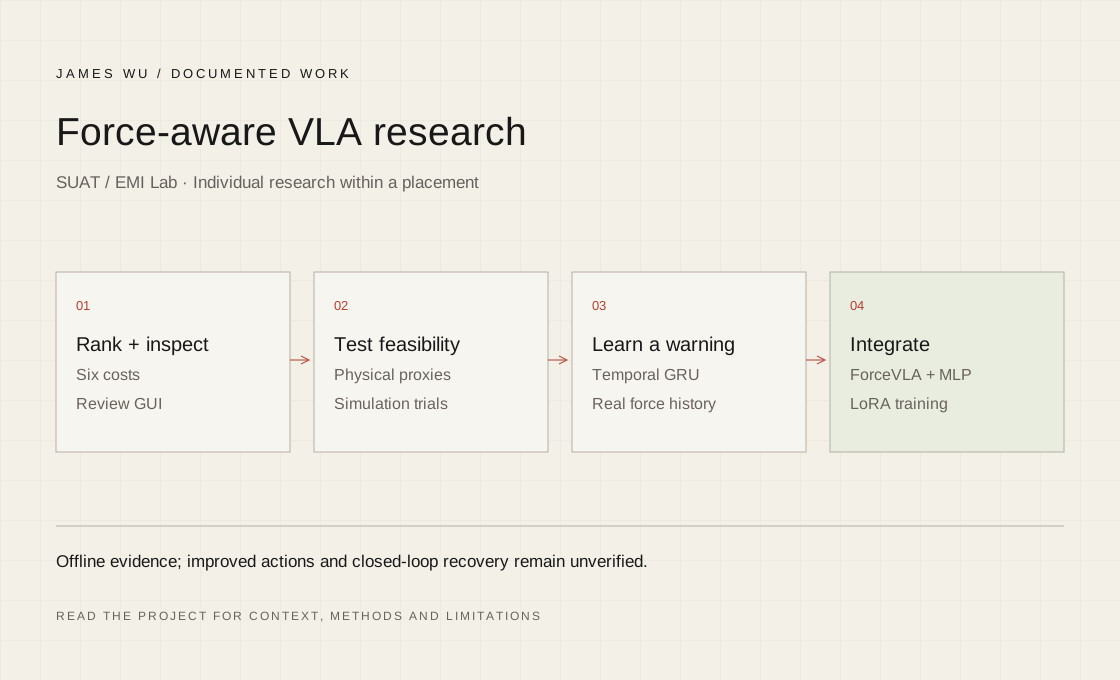
A standalone temporal model outperformed a current-force heuristic offline. The integrated ForceVLA risk head also learned the proxy risk signal; reliable action improvement and closed-loop performance remain unverified.
Independent projectIndependent research: trajectory ranking, simulation and risk-head training
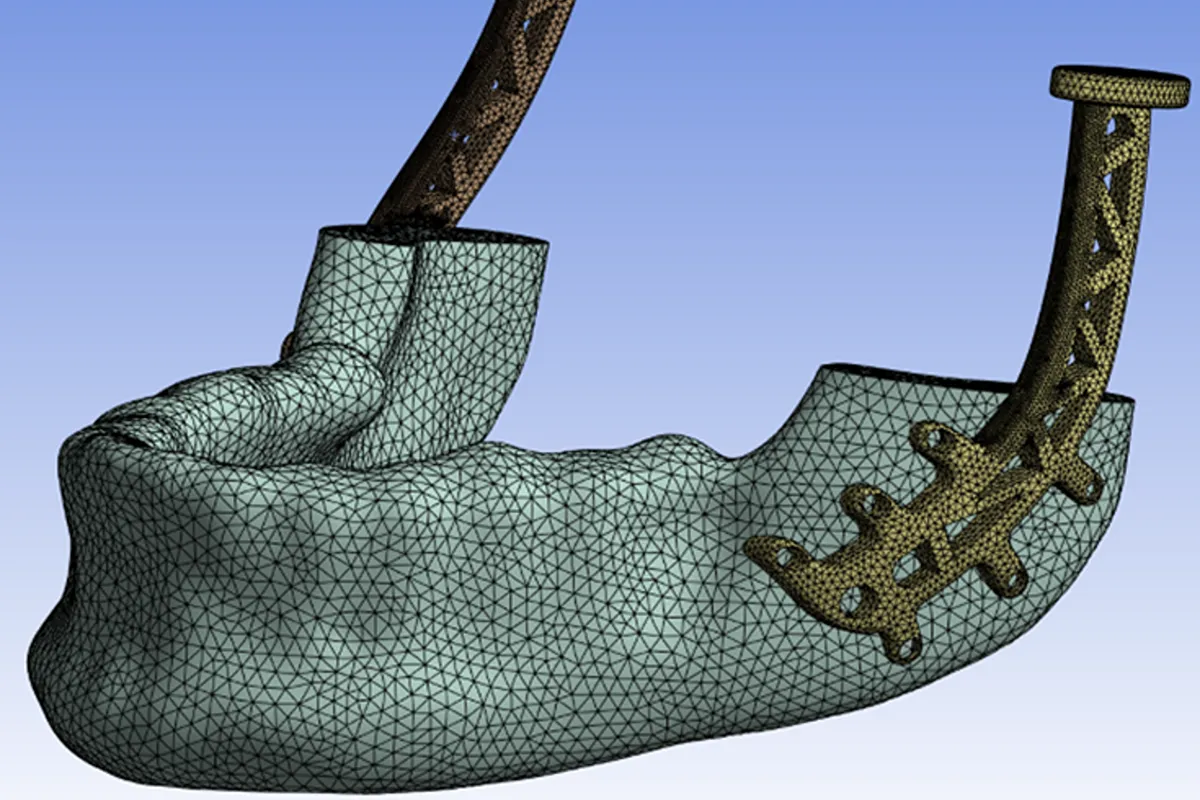
In simulation, the Ti-6Al-4V design reduced mass by 44.6% while meeting the assessed fatigue and modal targets.
Independent projectSimulation and optimisation
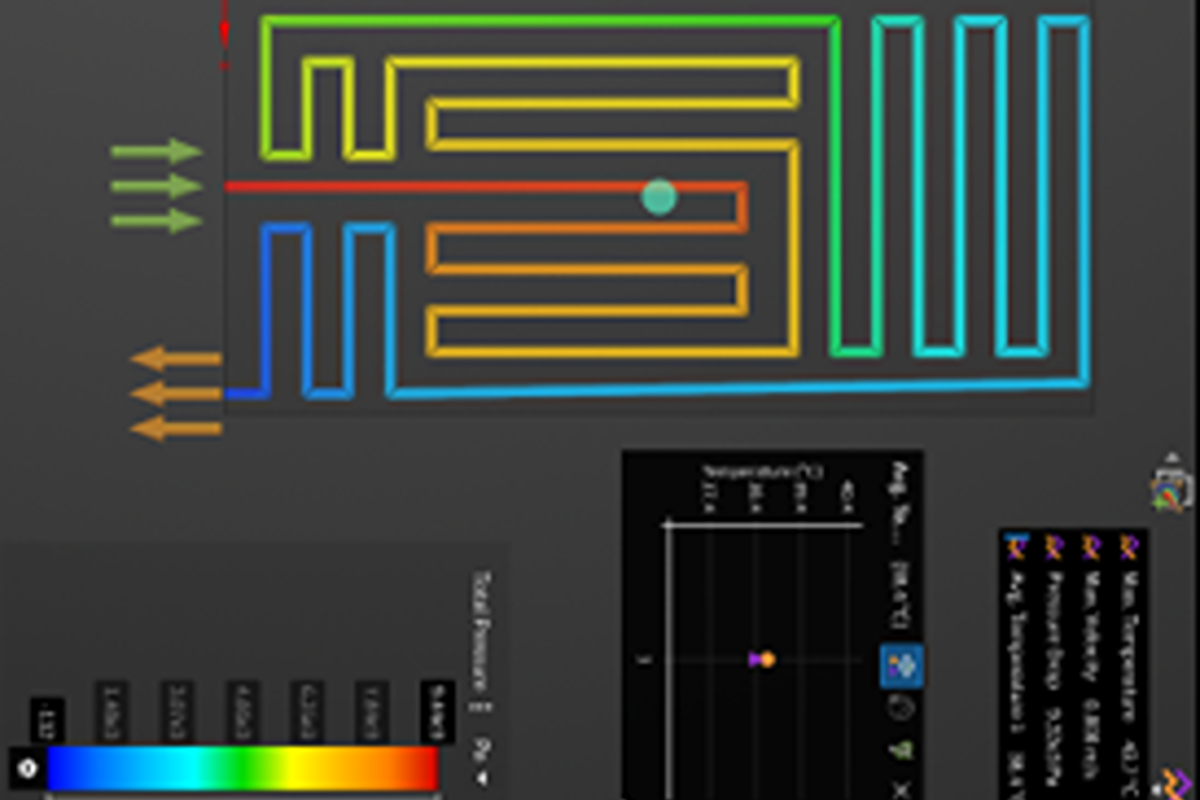
Under the assessed CFD boundary conditions, the design produced a pressure drop near 5.13 kPa and a 38.9°C average cell temperature.
Independent projectFlow-path design and simulation